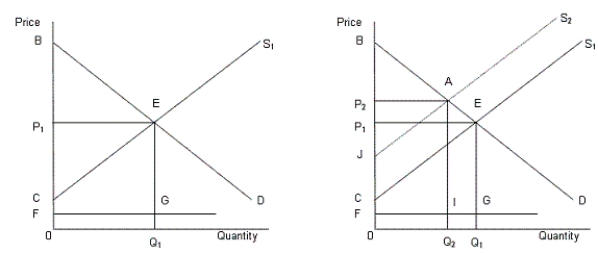
In the following figure, the first panel shows a market situation prior to regulation and the second panel shows the effects of regulation.Figure 14.2
 In the figure,
D: Demand curve for automobiles
S1: Supply curve of automobiles prior to regulation
S2: Supply curve of automobiles after regulation
FG: Clean up cost per unit
-Regulation of monopolies is justified on the ground that a monopolist sells too less at a too high price.
Definitions:
Measuring Performance
The process of evaluating the efficiency and effectiveness of action or operation, typically involving the comparison of actual outcomes with desired results or standards.
Desired Results
Specific outcomes or objectives that an individual or organization aims to achieve through their actions or strategies.
Control Equation
A tool or formula used in management and operations to assess and maintain the balance between desired outputs and various inputs or processes.
Performance Expectations
The standards or requirements set by an employer regarding how tasks should be performed and goals should be achieved by employees.
Q22: Which of the following laws was enacted
Q24: Buying a newly issued bond implies:<br>A)borrowing money
Q36: Problems of moral hazard and adverse selection
Q41: Refer to Figure 11.9. Suppose that the
Q46: Corporations can attract more lenders by offering
Q47: When all the costs and benefits of
Q55: Refer to Figure 14.4. A competitive labor
Q70: Which of the following is true of
Q75: In the case of automobile and medical
Q85: A local monopoly is a firm that:<br>A)is