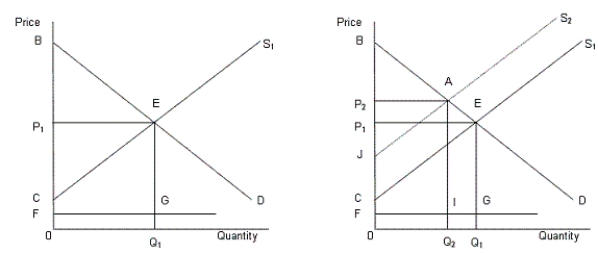
In the following figure, the first panel shows a market situation prior to regulation and the second panel shows the effects of regulation.Figure 14.2
 In the figure,
D: Demand curve for automobiles
S1: Supply curve of automobiles prior to regulation
S2: Supply curve of automobiles after regulation
FG: Clean up cost per unit
-Any kind of social regulation raises the per unit cost of production of a good and hence leads to a loss of producer and consumer surplus.
Definitions:
Financial Accounting
The field that focuses on the preparation and reporting of financial statements for external use by investors, regulators, and other stakeholders.
Managerial Accounting
The field of accounting that focuses on providing information to managers for use in planning, decision making, and operational control.
Managerial Accounting
This involves the steps of recognizing, assessing, scrutinizing, decoding, and sharing monetary details with management to facilitate the attainment of organizational aims.
Budget
A financial plan outlining an organization's revenue, expenditures, and capital for a specific period, guiding financial management and priorities.
Q8: Which of the following statements best describes
Q20: Rising income inequality is driven by:<br>A)an increase
Q21: As the wage rate increases, the quantity
Q44: Consider a market consisting of seven firms
Q50: The marginal factor cost (MFC) is the:<br>A)value
Q53: In Figure 18.1, the curve A indicates:<br>A)demand
Q69: Why are bonds less risky than stocks?<br>A)The
Q106: In many cities, the market for cab
Q111: In the case of public goods, _.<br>A)the
Q120: If market demand increases, a perfectly competitive