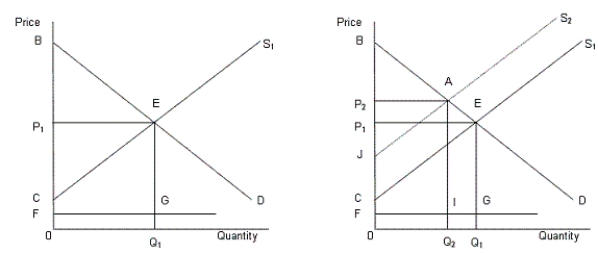
In the following figure, the first panel shows a market situation prior to regulation and the second panel shows the effects of regulation.Figure 14.2
 In the figure,
D: Demand curve for automobiles
S1: Supply curve of automobiles prior to regulation
S2: Supply curve of automobiles after regulation
FG: Clean up cost per unit
-According to Figure 14.2, the total social surplus after the regulation is the:
Definitions:
Margin
The difference between the selling price of a product or service and its production or acquisition costs, often expressed as a percentage of the selling price.
Incentives
Incentives are benefits or rewards provided to encourage specific behaviors or actions, playing a crucial role in economic decision-making.
Objectively Measured
Quantified or evaluated based on unbiased observations, data, or criteria, not influenced by personal feelings or opinions.
Association
An organized group of people who share a common interest, purpose, or goal, coming together to implement a wide range of activities.
Q8: Common ownership may fail to ensure that
Q26: If bonds and stocks are considered to
Q34: Regulation of enterprises by the government has
Q55: The largest stock exchange in the world
Q57: Price discrimination is best described as a
Q86: While equity funds are mostly made up
Q88: According to Figure 14.6, what is the
Q89: If in the short run, at the
Q102: Which of the following indexes includes the
Q104: In the case of positive externalities, too