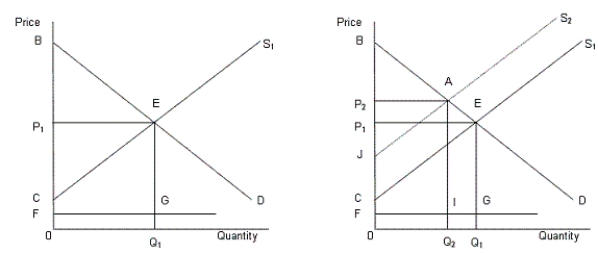
In the following figure, the first panel shows a market situation prior to regulation and the second panel shows the effects of regulation.Figure 14.2
 In the figure,
D: Demand curve for automobiles
S1: Supply curve of automobiles prior to regulation
S2: Supply curve of automobiles after regulation
FG: Clean up cost per unit
-Graphically, consumer surplus is the area:
Definitions:
Net Income
The remaining earnings of a business after subtracting all outgoings and tax liabilities from its total earnings.
Balance Sheet
A financial statement that reports a company's assets, liabilities, and equity at a specific point in time, giving insight into its financial position.
Income Statement
A financial statement that reports a company's financial performance over a specific period, including revenues, expenses, and net income.
Accrued Expenses
Expenses that have been incurred but not yet paid or recorded at the end of an accounting period.
Q1: Consider the resource market shown in Figure
Q6: Burger King has a direct demand for
Q10: According to Table 14.4, what is the
Q13: Consider the monopolistically competitive firm described in
Q36: Which of the following is most likely
Q43: Which of the following results from the
Q52: Which of the following transfer programs in
Q86: Under a marketable permit system, if the
Q87: Consider the monopolistically competitive firm described in
Q109: Households' expenditure on goods and services are