The figure given below shows the demand curves (D1 and D2) and supply curves (S1 and S2) of labor in the labor market.Figure: 16.2
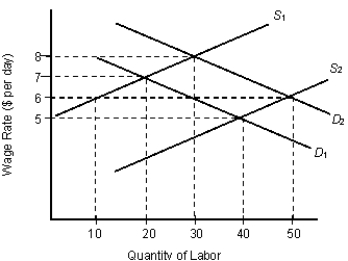
-Refer to Figure 16.2. At the initial equilibrium (when demand is D1 and supply is S1) , the firm employs _____ laborers at a wage of _____.
Definitions:
Marginal Wage Cost
The additional cost incurred by hiring one more unit of labor, reflecting the change in total wage expenses.
Monopsonistic Labor Market
A labor market in which a single firm is the sole or dominant buyer of labor, giving it power to set wages below competitive levels.
Marginal Revenue Product
The additional revenue generated for each additional unit of input, such as labor or capital, used in the production process.
Marginal Resource Cost
The increase in total cost that results from utilizing one additional unit of a resource in production.
Q11: What are the earnings of a resource
Q11: Refer to Table 13.2. Suppose fish sells
Q14: Per capita income is calculated as:<br>A)national income
Q14: Which of the following is true of
Q15: If international trade is restricted by the
Q22: Which of the following laws was enacted
Q24: Buying a newly issued bond implies:<br>A)borrowing money
Q62: Often the best way for a firm
Q64: A market in which adverse selection occurs
Q91: One of the major impacts of restricting