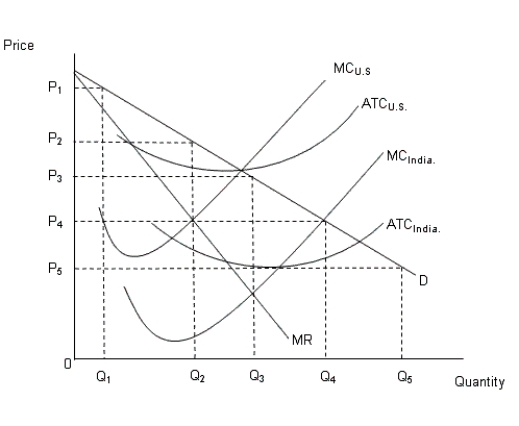
The figure given below shows the demand curve in the U.S. and the cost curves in U.S. and India.Figure: 16.4
 In the figure:
MC: Marginal cost curve
ATC: Average total cost curve
D: Demand curve in the U.S.MR: Marginal revenue curve in the U.S.
-In Figure 16.4, the price and quantity of the good if produced by India would be _____ and _____ respectively.
Definitions:
Fixed Costs
Expenses that remain constant regardless of the volume of production or sales, like lease payments or wages.
Variable Input(s)
Inputs or resources whose quantity can be changed in the short term to adjust the level of production.
Short Run
A period in economics where at least one factor of production is fixed, limiting the adjustments a firm or industry can make.
Inputs
Resources such as labor, materials, and capital that are used in the production process to create goods and services.
Q6: In Figure 11.9, what is the consumer
Q11: Suppose that the world price of kiwi
Q21: Although technically owning a share means the
Q26: It seems evident that countries would have
Q62: An imposition of tax by the government
Q72: We know that industrial countries tend to
Q72: When negative externalities exist in a market,
Q85: People tend to remain in those occupations
Q94: If employers have imperfect information about job
Q102: In Table 14.4, if marginal revenue product