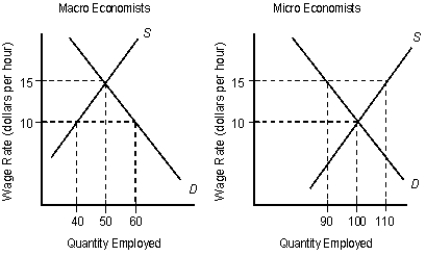
The following figures show the demand (D) and supply (S) curves of micro and macro economists.Figure 16.6

-The labor-market-supply curve illustrates that, as the wage rate increases, the number of hours that each person is willing and able to work rises.
Definitions:
Variability
A measure of the dispersion or spread of data points in a dataset, indicating how much the numbers differ from each other and from the mean.
Measures Of Variability
Statistics that describe the extent to which scores in a distribution differ from one another, including the range, variance, and standard deviation.
Spread
A statistical term describing the range, distance, or variance between data points in a dataset, indicating the variability within the data.
Scatter
In data visualization, a plot that displays the relationship between two or more variables by using dots to represent values.
Q6: A market that is shared equally by
Q15: Unlike nonrenewable resources, the timing of extraction
Q17: A firm that was initially a monopsonist,
Q32: A market is classified as a monopsony
Q47: A decline in the interest rate will
Q56: According to the idea of comparable worth,
Q63: Under a marketable pollution permit system, property
Q68: According to Table 20.1, the opportunity cost
Q71: Which of the following countries receives the
Q96: The policy of comparable worth has been