The figure given below shows the demand curves (D1 and D2) and supply curves (S1 and S2) of labor in the labor market.Figure: 16.2
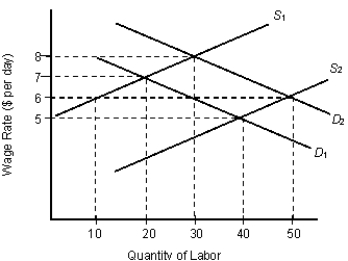
-In Figure 16.2, the initial labor supply is S1 , and the labor demand is D1. If the wage rate is $6, which of the following is correct?
Definitions:
Risk Breakdown Structure
A hierarchical decomposition of risks into categories and sub-categories that helps organize and define the total risk exposure of a project.
Planning Stage
The phase in which strategic actions and schedules are developed to achieve project objectives.
Risk Sharing
The practice of distributing identified risks among multiple parties to mitigate the impact on any single entity.
Total Risk
The complete range of possible risks that can affect a project, investment, or venture, encompassing both known and unknown factors.
Q2: Forcing members of a group into certain
Q4: Refer to Figure 20.2. The no-trade equilibrium
Q8: The perfectly competitive market structure results in
Q10: According to Table 14.4, what is the
Q16: Laws that require children to be inoculated
Q25: A monopolistically competitive market is characterized by:<br>A)one
Q37: The Austrian school of economists stressed on
Q50: Under George W. Bush's administration, antitrust policy:<br>A)became
Q53: According to Figure 14.2, the total clean
Q94: A tradable government permit for the atmospheric