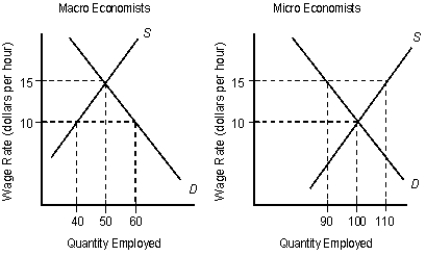
The following figures show the demand (D) and supply (S) curves of micro and macro economists.Figure 16.6

-Since we all like to get richer, so when wage rate increases we always like to work longer hours to make more income.
Definitions:
Supply Curves
Graphical representations that show the relationship between the price of a good or service and the quantity of that good or service that suppliers are willing to offer for sale.
Equilibrium Quantity
The quantity of goods or services that is supplied equals the quantity demanded at the market equilibrium price, at which point there is no tendency for the market price to change.
Personal Income Tax
A tax levied on the income of individuals, which can vary based on income levels and types of income.
State Excise Tax
Taxes imposed by a state on particular goods or activities, such as alcohol, cigarettes, and gasoline.
Q1: The simultaneous import and export of goods
Q7: The limits of the terms of trade
Q9: Which of the following are most likely
Q44: Which of the following statements, in the
Q47: When all the costs and benefits of
Q70: Suppose the production of helicopters is an
Q90: Refer to Figure 16.3. If the wage
Q92: Stock prices often fail to correctly reflect
Q96: The policy of comparable worth has been
Q112: Actions that allow oligopoly firms to coordinate