True/False
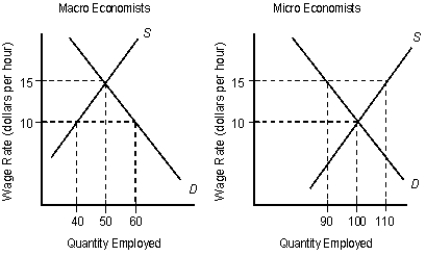
The following figures show the demand (D) and supply (S) curves of micro and macro economists.Figure 16.6

-The Chinese Exclusion Act of 1882 was the first restriction on immigration, in the U.S.
Definitions:
Related Questions
Q28: Countries should specialize and import goods in
Q36: Trade between industrial countries account for the
Q40: Which of the following is true of
Q49: Income inequality has risen in recent years
Q75: In order to induce risk-averse people to
Q82: Refer to Figure 21.4. If cocoa sells
Q89: Wage differentials exist because not all workers
Q95: The monopolistically competitive firm, in Figure 12.3,
Q98: The Gulf Cartel and Sinaloa Cartel are
Q101: The financial amount that a risk averse