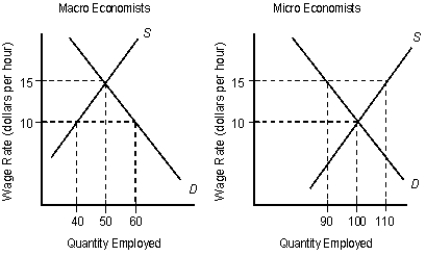
The following figures show the demand (D) and supply (S) curves of micro and macro economists.Figure 16.6

-The demand curve for capital:
Definitions:
Freight Costs
Freight costs are the charges involved in the transportation of goods from one place to another, often resulting from shipping or logistic operations.
Machine
A piece of equipment, generally powered mechanically, electrically, or digitally, used in the manufacturing or productive process.
Equipment Account
An account on the balance sheet that reports the value of equipment a company owns, less any accumulated depreciation.
Discount Taken
A reduction in the billed amount by a buyer, often for early payment, as an incentive from the seller.
Q11: Refer to Table 13.2. Suppose fish sells
Q32: Illegal immigrants to the U.S. usually charge
Q45: The Social Security tax structure in the
Q49: Economists typically date the beginning of the
Q58: When a good is subsidized by the
Q60: The most-favored customer is one who:<br>A)buys a
Q68: When a low-income individual receives a transfer
Q83: When the commons are converted into privately
Q88: Why does a network externality arise?<br>A)Each additional
Q104: In the case of positive externalities, too