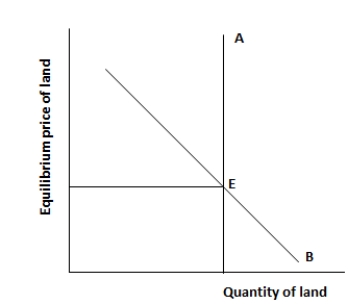
The figure given below represents an imperfectly competitive resource market. Here common land (and not land used for specific purpose) is under consideration.Figure 18.1

-The people of Andres, a small fishing village in a country, are facing extremely difficult times as their source of livelihood is threatened. Unregulated by the government, the coastline was subject to overfishing for a long time, adversely affecting the stock of fish. The variety of fish has declined and it takes much longer to haul in a decent catch these days. People in Andres are worried that they may have to migrate to other areas or look for alternative sources to earn a living. Which of the following is most similar to this scenario?
Definitions:
Total Surplus
The combined benefit that both consumers and producers receive from a transaction, comprising consumer and producer surplus.
Consumer Surplus
The difference between the total amount that consumers are willing and able to pay for a good or service (indicated by the demand curve) and the total amount that they actually do pay (i.e., the market price).
Producer Surplus
The difference between what producers are willing to accept for a good or service versus what they actually receive, often reflecting gains from trade.
Tariff Revenue
Income generated by a government from imposing tariffs on imported goods.
Q3: To avoid driving a natural monopolist into
Q7: Refer to Table 19.1. What percentage of
Q49: The accounting rate of return calculations ignores
Q50: Which of the following can be considered
Q51: If the rate of extraction of a
Q60: Investment in human capital implies:<br>A)investment on machines,
Q67: The labor demand curve is based on
Q76: According to the ratings given by Moody's
Q77: Purchasing power parity holds when the exchange
Q81: A regressive tax structure is one:<br>A)in which