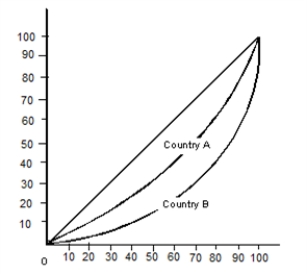
The figure given below shows the Lorenz curves of two countries (Country A and Country B) .Figure 19.2
Total income (cumulative percentage)
Total population (cumuative percentage)

-The extent to which people move from one income quintile to another over time is called _____.
Definitions:
Supply Manager
A professional responsible for overseeing and managing a company's sources of supply, including procurement and supply chain management.
Assurance-Of-Supply Strategies
Tactics employed to ensure a continuous and reliable supply of necessary resources and materials.
Supply
The total amount of a product or service available for purchase or consumption.
Demand
Represents the quantity of a product or service desired by consumers at a certain price point and time.
Q20: The supply of hydro electric power:<br>A)can be
Q26: At the internal rate of return (IRR),the
Q26: It seems evident that countries would have
Q32: A Gini of 0 implies that:<br>A)every family
Q36: After a company invests in capital assets,which
Q56: Suppose purchasing power parity exists in the
Q63: Before-tax incomes are a better measure of
Q76: A firm will demand more units of
Q89: In the light of the infant industry
Q128: Suppose the official gold value of the