The figure given below shows the import demand and export supply curves of corn in the U.S. and Mexico.Figure 20.2
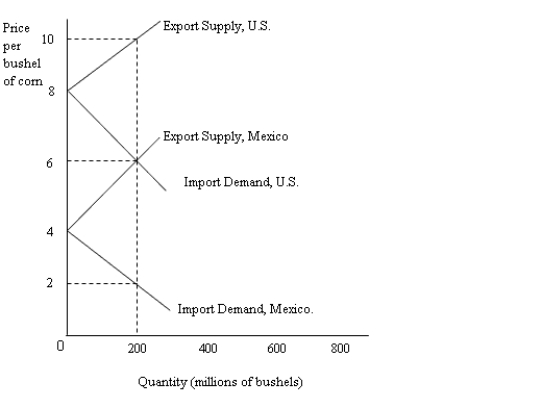
-Refer to Figure 20.2. The no-trade equilibrium price of a bushel of corn in Mexico is:
Definitions:
Overhead Assigned
The process of allocating indirect costs to specific cost objects, such as products, services, or departments.
Direct Labor-Hours
Direct labor-hours represent the total hours worked by employees directly involved in the manufacturing process, serving as a basis for allocating labor costs to products.
Traditional Costing
An accounting method that allocates manufacturing overhead based on the volume of a cost driver, such as the amount of labor or materials used.
Overhead Applied
The portion of overhead costs allocated to individual product units or service engagements based on a predetermined rate.
Q3: Taxes are one method of funding the
Q7: An individual's decision to supply her labor
Q36: Offshoring does not affect the percentage of
Q36: Trade between industrial countries account for the
Q45: The IMF mostly receives its funds from:<br>A)the
Q61: Offshoring refers to the the process in
Q73: Refer to Table 19.1. What percentage of
Q82: Healthier Cook Company manufactures two products:
Q84: The effect of an import quota on
Q100: Suppose a U.S. citizen purchases a one-year