Multiple Choice
The figure below shows the demand (D) and supply (S) curves of corn syrups.Figure 21.3
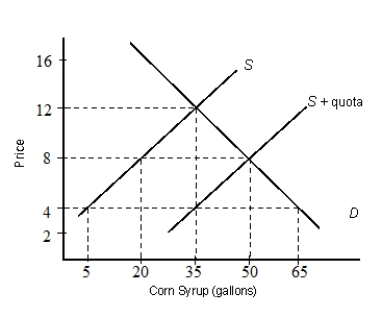
-Suppose, in the United States, each farmer is given a federal agricultural subsidy worth $30,000. What will be the effect of such subsidy?
Definitions:
Related Questions
Q8: When a U.S. importer needs $22,000 to
Q9: When natural resources are commonly owned, the
Q15: Which of the following is NOT a
Q16: Which of the following is NOT a
Q35: Yield on a bond refers to:<br>A)the coupon-rate
Q47: A proportional tax tends to:<br>A)reduce income inequality.<br>B)increase
Q66: Rica Company is a price-taker and
Q81: According to empirical observations, the cost of
Q82: An Australian investor buys a U.S. Treasury
Q92: Between two countries, comparative advantage is found