The figure given below depicts the demand and supply of Brazilian reals in the foreign exchange market. Assume that the market operates under a flexible exchange rate regime.Figure 22.1
In the figure:
D1 and D2: Demand for Brazilian reals
S1 and S2: Supply of Brazilian reals
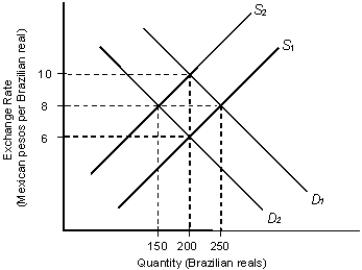
-Refer to Figure 22.1. Assume that the initial equilibrium exchange rate is 6 pesos per real. Other things remaining equal, an increase in the number of Brazilian tourists to Mexico is most likely to:
Definitions:
Production Possibilities Curve
A visual diagram illustrating the highest potential production mixes of two products or services that an economy can reach when it uses all its resources in a completely efficient manner.
Stable Supply Curve
A situation in which the supply curve remains unchanged over time, indicating that the quantity supplied is not affected by changes in price.
Increasing Demand
A situation where the quantity of a good or service that consumers are willing and able to buy increases, often due to factors like rising incomes, changes in tastes, or lower prices of the product.
Allocative Efficiency
A state of resource allocation where it is impossible to make any one individual better off without making at least one individual worse off.
Q4: Anthony Company's highest point of total cost
Q17: Jenna Manufacturers produces flooring material.The monthly fixed
Q44: Fox Ltd manufactures and sells pens for
Q47: Following details are provided by Dopler
Q79: Consider a mutual fund with a 6
Q79: CM Manufacturing has provided the following
Q84: The benefit foregone by NOT choosing an
Q102: Which of the following is TRUE for
Q116: Which of the following is the format
Q169: Which of the following is NOT an