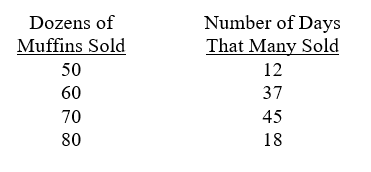
A pastry store wants to know how many dozen muffins to bake each day.Every dozen they sell fresh in the shop returns a profit of $5.00.Every dozen they bake but do not sell on the day they are baked is given to a local charity at a loss of $3.00 a dozen.The business is fairly stable in that they never sell less than 50 dozen nor more than 80 dozen muffins.Their sales history, rounded to the nearest ten dozen muffins is as shown:
 They want to run a ten day simulation for production rates of 50, 60, 70, and 80 muffins to determine the profit (loss) for each.They generated the following random numbers for days 1-10 respectively: 63, 13, 67, 50, 71, 25, 44, 00, 56, and 68.
a.What range of random numbers corresponds to 70 muffins sold?
b.What is the profit for day 3 if they make 70 dozen muffins?
c.What is the average daily profit (for all ten days) corresponding to 60 dozen muffins made?
Definitions:
Distribution Shape
The geometric arrangement of a dataset, describing how data is organized around the central tendency, including forms such as bell-shaped, skewed, or uniform.
Stem And Leaf Display
A graphical method of displaying numerical data that helps to retain the individual scores.
Modal Hours
The most frequently occurring hours in a set of data.
Median Number
Median number is the middle value in a list of numbers arranged in order, separating the higher half from the lower half of the dataset.
Q9: The most widely traded currency in the
Q14: An operator has determined what her percent
Q19: Which of the following is generally correct
Q25: Which foreign currency translation standard uses the
Q27: In order the minimize the effects of
Q30: The total amount of branch profits included
Q31: A food processing company makes meatloaf to
Q36: By using two-servers for airport check-ins instead
Q37: In the compagnie accounting system developed in
Q38: Using a cause-and-effect diagram helps identify the