Exhibit 10.2
The following questions are based on the problem description and the output below.
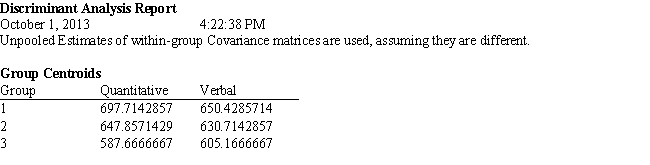
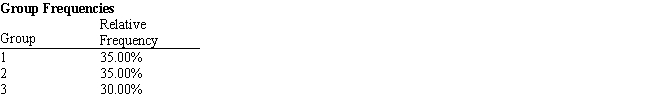
A college admissions officer wants to evaluate graduate school applicants based on their GMAT scores, verbal and quantitative. Students are classified as either successful (Group 1) , marginally successful (Group 2) or not-successful (Group 3) in their graduate studies. The officer has data on 20 current students, 7 successful (Group 1) , 6 marginally successful (Group 2) and 7 not successful (Group 3) . 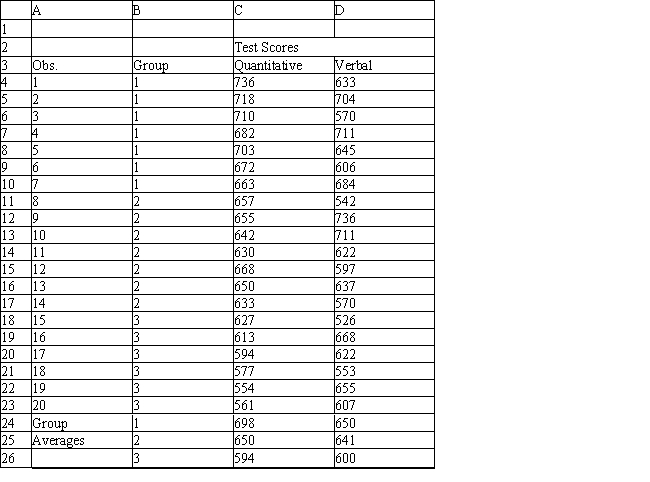
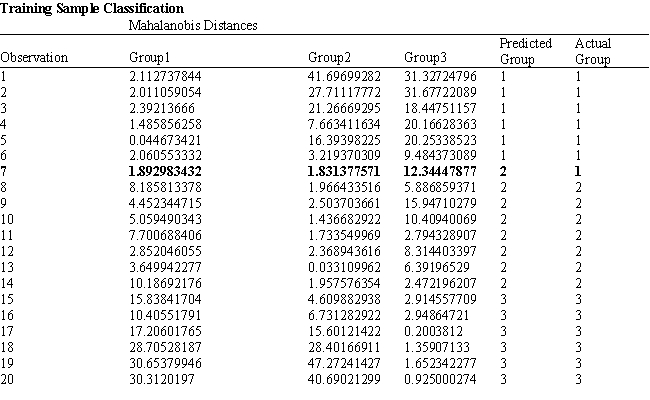
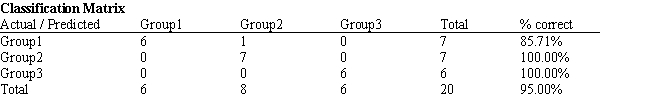
-Refer to Exhibit 10.2. What number of observations is classified correctly?
Definitions:
Descriptive Statistics
Statistical methods that summarize and organize data in an informative way, without drawing conclusions beyond the data itself.
Central Tendency
A statistical measure that identifies a single value as representative of an entire distribution of data, such as the mean, median, or mode.
Statistical Process Control
A method used in manufacturing and business processes to control quality by monitoring and controlling the process through statistical analysis.
Statistical Analysis
The process of collecting, analyzing, interpreting, and presenting data to gain insights or support decision-making.
Q1: A convenience store chain is considering opening
Q6: What is the mean arrival rate based
Q7: Suppose that the regrets for an alternative
Q9: The error sum of squares term is
Q12: What is the service policy in the
Q14: Which of the following is not an
Q17: Which of the following cannot be negative?<br>A)coefficient
Q40: The Reduced Gradient is similar to which
Q54: Refer to Exhibit 7.2.What formula goes in
Q58: Activity-on-Arc AOA)networks do not allow multiple arcs