Project 12.1 ? Monte Carlo Integration
A common application of Monte Carlo simulation is to provide numerical approximations.One such application is to approximate the area under a curve,or Monte Carlo integration.The following figure represents such a curve,defined over the range of X = 0 to X = 13.Call the area under this curve A.
Monte Carlo integration begins by overlaying on the curve of interest a region call this region,B)whose area is easy to calculate i.e. ,a box).Monte Carlo integration then involves the random generation of points in B and a determination of the percentage of these points that fall in A i.e. ,fall below the curve).This percentage represents that portion of the area of B that is the area of A.
Use Monte Carlo integration techniques to approximate the area under the curve.Use exact techniques to calculate the true area under the curve.How accurate is your approximation? 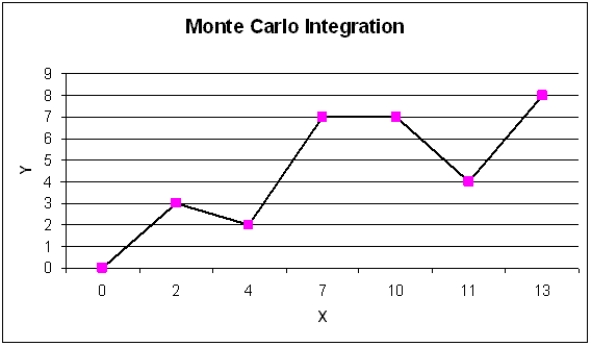
Definitions:
Numerical Data
Quantitative information consisting of numbers, which can be used in statistical analysis to produce findings or prove hypotheses.
Descriptive Responses
Answers or feedback that provide detailed information or elaboration on a subject.
Respondent Samples
Groups of individuals selected to participate in research or surveys, intended to represent a larger population for the purpose of gathering data.
Data
Quantitative or qualitative values, facts, statistics, or information collected for reference or analysis.
Q6: What is the mean arrival rate based
Q13: Refer to Exhibit 11.10.What are predicted sales
Q18: Risk that cannot be eliminated by diversification
Q19: Which of the following definitions correctly defines
Q23: An investor is considering 4 investments,A,B,C,D.The payoff
Q31: Risk that can be eliminated by diversification
Q39: An investor calculating the standard deviation of
Q55: Refer to Exhibit 11.6.What formula should be
Q57: A time series which has a significant
Q59: A company wants to use PERT to