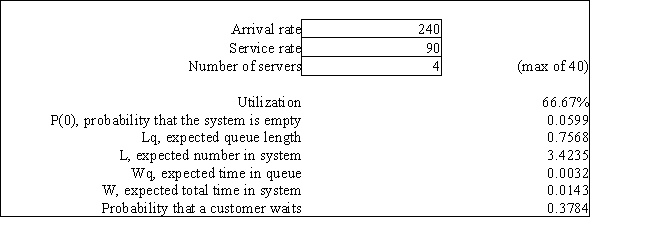
Exhibit 13.4
The following questions refer to the information and output below.
A grocery store can serve an average of 360 customers per hour. The service times are exponentially distributed. The store has 4 checkout lines each of which serves 90 customers per hour. Customers arrive at the store at a Poisson rate of 240 customers per hour. The following queuing analysis spreadsheet was developed from this information. 
-Refer to Exhibit 13.4. Based on this report what is the average total time spent in line and being checked out?
Definitions:
Q1: Refer to Exhibit 11.11.What formula should be
Q8: Refer to Exhibit 14.2.What formula should go
Q24: Refer to Exhibit 15.4.Manually determine the earliest
Q27: Refer to Exhibit 14.10.Complete the following table
Q37: The forecasting model that makes use of
Q49: Two approaches to clustering discussed in the
Q58: Refer to Exhibit 14.9.What decision should be
Q61: Why did M1 grow so rapidly in
Q66: Refer to Exhibit 9.1.Test the significance of
Q82: Plots useful in data mining analysis can