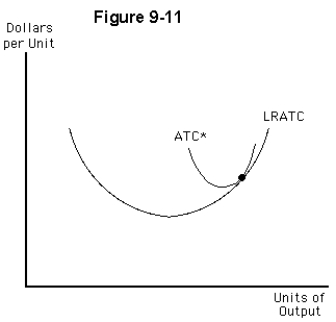
-Figure 9-11 illustrates the long-run average total cost curve for a perfectly competitive firm and the short-run average total cost curve (ATC*) for the firm's current plant size.In the long run,this
Definitions:
Perfect Competitor
A market structure characterized by an infinite number of small firms, identical products, and free entry and exit, ensuring no single firm can influence market prices.
Industry-Wide Supply and Demand
The total quantity of goods and services that are available for purchase across an entire industry, alongside the total quantity that consumers are willing and able to buy within that industry.
Short-Run
A period in economics where at least one factor of production is fixed, and firms can't alter all inputs.
Long-Run
A period in economic theory during which all factors of production and costs are variable, allowing for full adjustment to changes.
Q21: Which of the following explains why long-run
Q49: What is the profit-maximizing level of output
Q72: The income effect of a lower price
Q86: Samantha has been working for a law
Q91: The demand curve for Apple iTune music
Q92: If a firm shuts down in the
Q105: Which of the following helps to classify
Q107: Suppose that Carla's Candy Shop finds that
Q133: Which of the following is not considered
Q144: A natural monopoly is producing an output