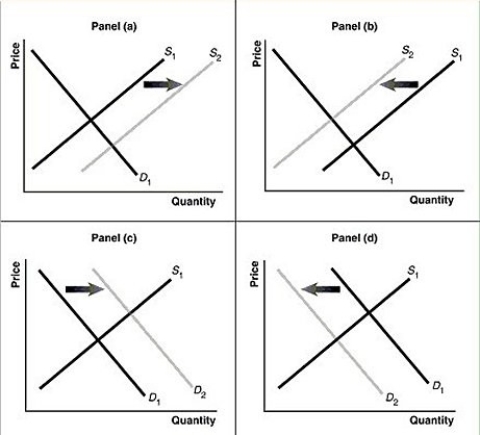
Figure 3-7

-Refer to Figure 3-7.Assume that the graphs in this figure represent the demand and supply curves for women's clothing.Which panel best describes what happens in this market when the wages of seamstresses rise?
Definitions:
Industry
A group of companies or organizations that produce similar goods or services.
Purely Competitive
A purely competitive market is one with many sellers and buyers where no single entity has significant control over prices and where products are largely undifferentiated, leading to market equilibrium determined by supply and demand.
Total Profit
The total financial gain made by a business after subtracting all costs and expenses from total revenue.
Short Run
A time period in economics during which at least one input is fixed and cannot be changed by the firm, contrasting with the long run where all inputs are variable.
Q3: Refer to Table 5-7.The equations above describe
Q15: Shifts in the supply of oil have
Q18: Suppose your expenses for this term are
Q37: The graph below represents the market for
Q40: Refer to Figure 5-4.The figure above represents
Q56: Adam Smith's invisible hand refers to<br>A)the government's
Q109: What shape does a production possibility frontier
Q155: Refer to Figure 2-3.A movement from Y
Q166: Producer surplus is the difference between the
Q233: The income effect of an increase in