Figure 3-8 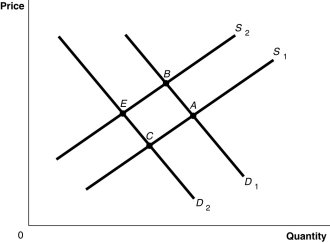
-Refer to Figure 3-8.The graph in this figure illustrates an initial competitive equilibrium in the market for sugar at the intersection of D1 and S2 (point B) .If there is a decrease in the price of fertilizer used on sugar cane and there is a decrease in tastes for sugar-sweetened soft drinks,how will the equilibrium point change?
Definitions:
Compounded Quarterly
The process where interest is added to the principal sum of a deposit or loan every quarter, so that the added interest also earns interest from then on.
Final Payment
The last payment made to settle the balance of a financial obligation, such as a loan or mortgage.
Borrower
An individual, company, or institution that receives funds from a lender under the condition of paying back the borrowed amount plus interest.
Compounded Monthly
Interest calculated monthly on the principal sum plus previously earned interest.
Q42: 'Because chips and salsa are complements,an increase
Q58: Which of the following would shift a
Q61: Refer to Table 2-5.What is Barney's opportunity
Q62: Suppose when Nablom's Bakery raised the price
Q72: The demand curve for canned peas is
Q81: If demand is perfectly elastic,the absolute value
Q134: If the price of grapefruit rises,the substitution
Q152: What is the ceteris paribus condition?
Q177: The payment received by suppliers of entrepreneurial
Q181: As the number of firms in a