The graph below represents the market for lychee nuts. The equilibrium price is $7.00 per bushel, but the market price is $5.00 per bushel. Identify the areas representing consumer surplus, producer surplus, and deadweight loss at the equilibrium price of $7.00 and at the market price of $5.00. 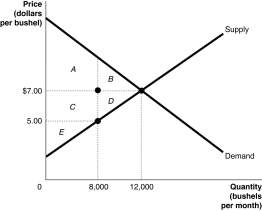
Definitions:
Inelastic Demand
A situation in which the demand for a product does not increase or decrease significantly when the price changes.
Monopoly Power
Monopoly power denotes the extent to which a firm can set the price for its product above marginal cost due to the lack of competition in its market.
Producer Surplus
The difference between what producers are willing to sell a good for and the actual market price they receive.
Competitive Level
pertains to the degree of competition within a market, influencing factors such as pricing, product differentiation, and market entry or exit.
Q16: Suppose a negative externality exists in a
Q17: If the average productivity of American firms
Q37: Supply is elastic whenever the elasticity value
Q91: Refer to Table 4-7. What is the
Q159: How will the exchange rate (foreign currency
Q183: Explain how the decision by parents to
Q198: In economics, the optimal level of pollution
Q241: Refer to Figure 4-6. What area represents
Q266: A quasi-public good differs from a public
Q389: Refer to Figure 4-18. As a result