Multiple Choice
Figure 4-3 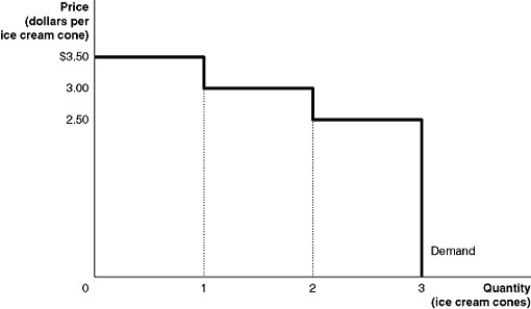 Figure 4-3 shows Kendra's demand curve for ice cream cones.
-Refer to Figure 4-3. If the market price is $2.50, what is Kendra's consumer surplus?
Definitions:
Related Questions
Q33: Refer to Figure 5-4. What is the
Q83: Which of the follow is a result
Q147: The United States abandoned the Bretton Woods
Q157: Refer to Figure 4-6. What area represents
Q180: "A competitive market achieves economic efficiency by
Q194: Suppliers will be willing to supply a
Q217: Refer to Figure 30-3. If the Thai
Q403: Congress passed the Freedom to Farm Act
Q416: If a tax is imposed on a
Q418: Rent control is an example of a