Table 4-8
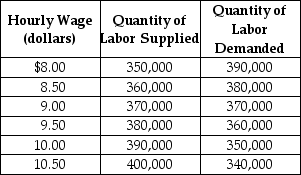 Table 4-8 shows the demand and supply schedules for the low-skilled labor market in the city of Westover.
-Refer to Table 4-8. Suppose that the quantity of labor supplied decreases by 40,000 at each wage level. What are the new free market equilibrium hourly wage and the new equilibrium quantity of labor?
Definitions:
Loyal
The quality of being faithful or devoted to a person, country, group, or cause.
Stockholders
Individuals or entities that own shares of stock in a corporation, making them partial owners of the company.
Marginal Efficiency
The rate of return on an investment that is additional or marginal to the current level of investment.
Capital
Assets or resources, such as machinery, buildings, or money, that can be used to produce goods and services and generate wealth.
Q4: In a fixed exchange rate system, speculation
Q15: If inflation in Russia is higher than
Q62: Firms in Thailand that had _ while
Q78: Refer to Figure 4-4. What is the
Q79: Refer to Figure 4-17. Suppose the market
Q81: Why are foreign investors more likely to
Q112: Producer surplus is the difference between the
Q122: The following equations represent the demand and
Q171: In 1991, Argentina decided to peg its
Q216: In what year was the Bretton Woods