Figure 4-20 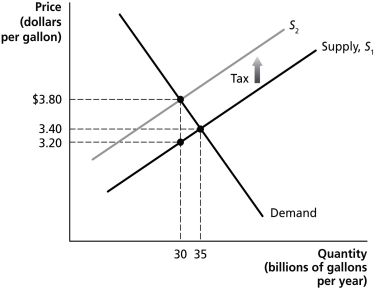
-Refer to Figure 4-20. The figure above represents demand and supply in the market for gasoline. Use the diagram to answer the following questions.
a. How much is the government tax on each gallon of gasoline?
b. What portion of the unit tax is paid by consumers?
c. What portion of the unit tax is paid by producers?
d. What is the quantity sold after the imposition of the tax?
e. What is the after-tax revenue per gallon received by producers?
f. What is the total tax revenue collected by the government?
g. What is the value of the excess burden of the tax?
h. Is this gasoline tax efficient?
Definitions:
Recession
A recession is an economic downturn spread across the economy lasting more than a few months, often visible in real GDP, real income, employment, industrial production, and wholesale-retail sales.
Booming Economy
A fast-growing economy characterized by rapid increases in production, sales, and typically, employment levels.
Principle of Diversification
A risk management strategy that mixes a wide variety of investments within a portfolio to minimize the impact of any single asset's performance.
Investment
An investment refers to the allocation of resources, usually money, in expectation of generating an income or profit, involving assets such as stocks, bonds, real estate, or commodities.
Q55: The graph below represents the market for
Q163: Refer to Figure 3-1. If the product
Q173: A. C. Pigou argued that the government
Q176: If, at the current exchange rate between
Q258: Refer to Table 3-3. The table above
Q313: Refer to Figure 4-3. Kendra's marginal benefit
Q319: If marginal benefit is less than marginal
Q339: You are given the following market data
Q414: Refer to Figure 4-15. For each unit
Q418: Rent control is an example of a