Figure 27-8 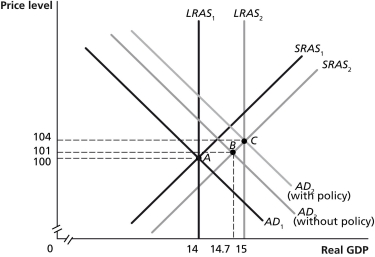
-Refer to Figure 27-8. In the graph above, suppose the economy in Year 1 is at point A and expected in Year 2 to be at point B. Which of the following policies could the Congress and the president use to move the economy to point C?
Definitions:
Taxes
Obligatory charges imposed by the government on the earnings of employees, profits of companies, or included in the prices of various goods, services, and transactions.
Income Tax
A tax levied by governments on individuals or entities based on their income or profits.
Taxable Income
The amount of income subject to taxes, after deductions and exemptions, according to the tax laws governing the taxpayer.
Tax Rate
The percentage at which an individual or corporation is taxed by the government on income, property, or sales.
Q8: Most economists believe that the best monetary
Q20: Refer to Figure 26-11. In the dynamic
Q53: If the Fed lowers its target for
Q118: Parker Hannifin benefitted when the Federal Reserve
Q119: When individuals use all available information about
Q169: Assume a closed economy, that taxes are
Q171: If weak aggregate demand is pushing the
Q175: Investment (I) in the United States may
Q191: The short-run Phillips curve is _ than
Q253: Does expansionary fiscal policy directly increase the