Table 2-32
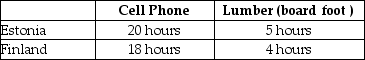
-Refer to Table 2-32. This table shows the number of labor hours required to produce a cell phone and a board foot of lumber in Estonia and Finland.
a. If each country has a total of 3,600 labor hours to devote to the production of the two goods, draw the production possibilities frontier for each country. Put "Cell Phone" on the horizontal axis and "Lumber" on the vertical axis. Be sure to identify the intercept values on your graphs.
b. Suppose each country allocates 55% its labor hours to lumber production and 45% to the production of cell phones. Complete Table 2-33 below to show each country's output of the two products.
Table 2-33: Production and Consumption with no Trade
 c. If the two countries do not trade and consume whatever they produce, identify the current production and consumption point for each country on their respective production possibilities frontiers. Label Estonia's consumption point "E" and Finland's consumption point, "F."
d. Suppose the two countries specialize and trade. Who should produce cell phones and who should produce lumber? Explain your answer.
e. Complete Table 2-34 below to show each country's output with specialization.
Table 2-34: Output with Specialization
 f. Did specialization increase the combined output for the two countries without any increase in resources? If so, by how much?
g. Suppose Estonia and Finland agree to trade so that in exchange for 400 board feet of lumber, the exporter of lumber receives 90 cell phones. Complete Table 2-35 below to show each country's consumption bundle after trade.
Table 2-35: Consumption with Trade
 h. Show the consumption points after trade on each country's production possibilities frontier. Label these points "X" for Estonia and "Y" for Finland.
i. Has trade made the two countries better off? Explain your answer.
Definitions:
Taxed
Subjected to a financial charge or levy by a government on income, goods, or activities.
Progressive Tax
A tax system in which the tax rate increases as the taxable amount increases, resulting in those who have higher incomes being taxed at a higher rate.
Progressive Tax
A taxation system where the tax rate increases as the taxable amount or income increases.
Proportional Tax
A tax system wherein the tax rate is fixed and applied uniformly to all taxpayers, regardless of their income level.
Q41: Because the copyright on the L. Frank
Q44: Refer to Figure 2-12. What is the
Q131: Both presidents Kennedy and Reagan proposed significant
Q157: The values of real GDP and real
Q161: When prices are rising, which of the
Q208: Refer to Figure 2-4. Consider the following
Q225: Refer to Table 2-17. What is James's
Q446: Scarcity<br>A) stems from the incompatibility between limited
Q477: Refer to Figure 2-13. Which country has
Q482: Refer to Table 2-19. Which of the