Table 2-21
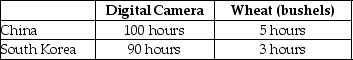
-Refer to Table 2-21. This table shows the number of labor hours required to produce a digital camera and a bushel of wheat in China and South Korea.
a. If each country has a total of 9,000 labor hours to devote to the production of the two goods, draw the production possibilities frontier for each country. Put "Digital Camera" on the horizontal axis and "Wheat" on the vertical axis. Be sure to identify the intercept values on your graphs.
b. Suppose each country allocates 60% its labor hours to wheat production and 40% to the production of digital cameras. Complete Table 2-22 below to show each country's output of the two products.
Table 2-22: Production and Consumption with no Trade
 c. If the two countries do not trade and consume whatever they produce, identify the current production and consumption point for each country on their respective production possibilities frontiers. Label China's consumption point "C" and South Korea's consumption point, "K."
d. Suppose the two countries specialize and trade. Who should produce digital cameras and who should produce wheat? Explain your answer.
e. Complete Table 2-23 below to show each country's output with specialization.
Table 2-23: Output with Specialization
 f. Did specialization increase the combined output for the two countries without any increase in resources? If so, by how much?
g. Suppose China and South Korea agree to trade so that in exchange for 1,200 bushels of wheat, the exporter of wheat receives 48 digital cameras. Complete Table 2-24 below to show each country's consumption bundle after trade.
Table 2-24: Consumption with Trade
 h. Show the consumption points after trade on each country's production possibilities frontier. Label these points "B" for China and "J" for South Korea.
i. Has trade made the two countries better off? Explain your answer.
Definitions:
Portfolio Beta
An indicator of the level of systematic risk or volatility in a portfolio relative to the overall market.
Market Portfolio
A portfolio consisting of all assets available in the market, with each asset weighted according to its market capitalization.
Risk-free Rate
A hypothetical yield of an investment that is considered to have no financial risk, usually mirrored by the returns on government bonds.
Abnormal Return
The difference between the actual return of an investment and the expected return given its risk and the market's performance.
Q53: If prices in the economy rise, then<br>A)
Q120: Which of the following statements about the
Q130: Which of the following statements refers to
Q150: Imagine that you borrow $1,000 for one
Q162: Refer to Table 2-13. What is Tammi's
Q167: Refer to Figure 2-14. Which country has
Q261: Nominal GDP will increase<br>A) only if the
Q290: When the actual inflation rate turns out
Q422: For each watch that Switzerland produces, it
Q470: In a production possibilities frontier model, a