Figure 17-6 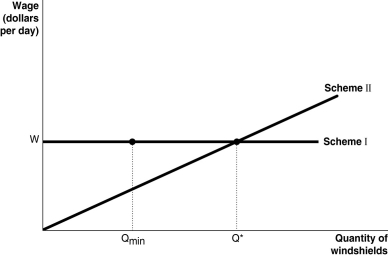 Figure 17-6 shows two different compensation schemes for the Safelite Glass Corporation, an installer of auto glass windshields. Under Scheme I, the firm pays a consistent wage of $80 per day based on an 8-hour workday. Qmin represents the cut-off point under the hourly-wage system: if a worker installed fewer than Qmin windshields, the worker got fired. Scheme II represents a piece-rate scheme with an earnings floor: no worker would get less than $80 per day (for an 8-hour workday) and would have to produce at least Qmin. For any output level beyond Q* the worker earned an additional $20 for each unit produced.
-Refer to Figure 17-6. Under Scheme I,
Definitions:
Market Demand Curve
A graphical representation showing the relationship between the price of a good and the total quantity demanded across all consumers in the market.
Marginal Cost
The financial requirement to produce an additional unit of a product.
Inelastic
Describes a situation where the demand for a good or service is relatively unresponsive to changes in its price.
Market Power
Market power is the ability of a firm or a group of firms to raise and maintain prices at above-normal levels, influencing the terms and conditions of a particular market.
Q17: Marginal revenue product can be calculated using
Q102: What is cost-plus pricing? Why do some
Q133: The decision to make the U.S. income
Q155: As the value of the Gini coefficient
Q190: Refer to Figure 15-6. The monopolist's total
Q207: Which of the following economists is best
Q223: For most low-wage earners,<br>A) the income effect
Q237: Refer to Table 15-4. What is the
Q243: That some talented people may not enter
Q255: In a study conducted by Marianne Bertrand