Figure 4.6: Production Function 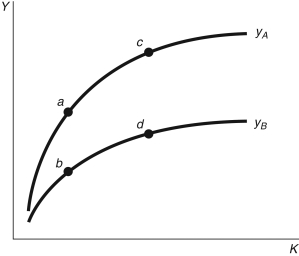
-Consider the two production functions in Figure 4.6, representing two countries. Which of the following is true?
i. At points a and b, each country has the same per capita capital stock but different factor productivity.
ii. Points a and c represent the same country but with different factor productivity.
iii. Points b and d represent the same country but with different stock of per capita capital.
Definitions:
Q1: By purchasing a fixed-rate 30-year mortgage,inflation risk:<br>A)is
Q11: In the Romer model,_ is the driving
Q14: The real interest rate is:<br>A)the interest rate
Q17: The production function <img src="https://d2lvgg3v3hfg70.cloudfront.net/TB4305/.jpg" alt="The production
Q37: If NGDP is nominal GDP and
Q45: In the Solow model,it is assumed that
Q51: Defining the growth of variable zt as
Q63: If a bank offers you a 30-year
Q77: In times of high inflation,shoe-leather costs rise.
Q87: Consider the data in the following table,which