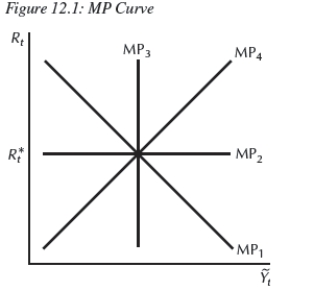
-In Figure 12.1,if the Federal Reserve sets the real interest rate at 
,which line represents the MP curve?
Definitions:
Aggregate Demand
represents the total demand for all final goods and services in an economy at a given time and price level.
Supply Curves
A graphical representation showing the relationship between the price of a good or service and the quantity of it that suppliers are willing to offer at that price.
Real GDP
The measure of a country's economic output adjusted for price changes (inflation or deflation), reflecting the true value of goods and services produced.
Supply Curves
A graphical representation that shows the relationship between the price of a good or service and the quantity that suppliers are willing to offer for sale at that price, over a given period.
Q9: In the Phillips curve, <img src="https://d2lvgg3v3hfg70.cloudfront.net/TB4305/.jpg" alt="In
Q16: Consider Table 7.1.In January 2007,the unemployment rate
Q17: The risk premium raises the borrowing rate
Q25: Between January 1985 and January 1990 the
Q26: Consider two economies.Economy 1 has a steep
Q45: If the Fed mistakenly believes that potential
Q52: Let r denote the real interest rate,i
Q81: An increase in planned investment expenditures is
Q92: What is the best definition of the
Q97: The high growth rates of money in