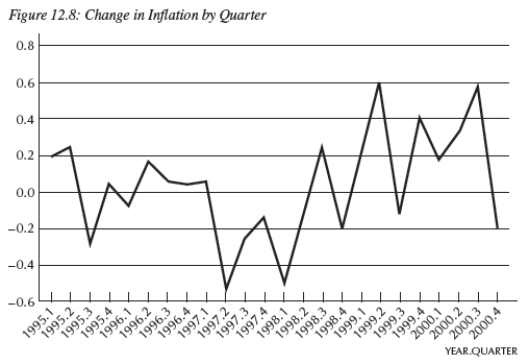
-Consider Figure 12.8,which shows the change in inflation 
From 1995.1 to 2000.4,by quarter.You are Federal Reserve chairman Greenspan and today's date is the second quarter of 1997 (1997.2) .Given the information you have,using the Phillips curve,to stabilize the economy,you would __________,risking __________.
Definitions:
CPI
A calculation tool, the Consumer Price Index, measures the mean prices of a selected basket of consumer services and goods including food, transportation, and medical services via their weighted average.
Prices Increase
A rise in the general level of prices for goods and services in an economy over a period of time, often indicating inflation.
Unemployment Rate
The portion within the labor force actively seeking work yet remains unemployed.
Employed
Refers to individuals who are currently working for pay or profit, including full-time and part-time positions, as well as temporary and seasonal work.
Q11: The equation used to predict movements in
Q29: In financial economics models,a stock price is
Q34: Start from any equilibrium in Figure 12.5
Q38: The liquidity trap occurs when:<br>A)real interest rates
Q52: One reason we are interested in investment
Q55: Consider two economies with the following IS
Q68: The velocity of money can be calculated
Q76: A significant cause of the 2008 financial
Q95: Use the aggregate supply/aggregate demand model in
Q101: From the residential arbitrage equation: a rise