Multiple Choice
Figure 4.2 shows the demand curves for a good. A shift from demand curve D' to demand curve D in the figure below would be caused by a(n) :
Figure 4.2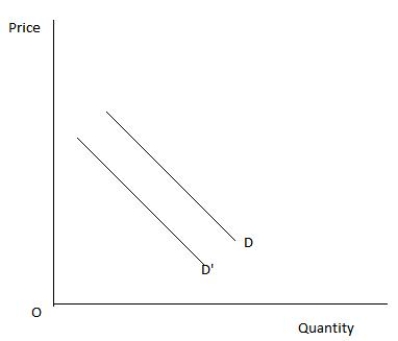
Definitions:
Related Questions
Q24: The following diagram shows Ken's demand curve
Q41: A downward-sloping straight-line production possibilities frontier indicates:<br>A)that
Q53: If demand decreases, then quantity supplied will
Q60: Which of the following would shift the
Q68: A group of farmers in southwestern Pennsylvania
Q108: Ed is willing to pay a maximum
Q115: Other things constant, the demand for a
Q139: If demand for personal computers increases as
Q144: Suppose Debbie is willing to pay $50
Q145: The slope of the demand curve for