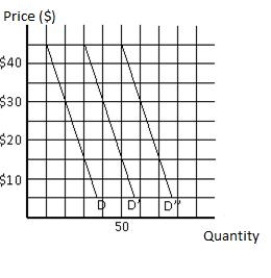
The following graph shows the demand curves for three consumers in the market, represented by D, D' and D''. At a price of $30, the market quantity demanded for the good will be _____ units.
Figure 6.10
Definitions:
Plantwide Overhead Rate
A single overhead absorption rate calculated for an entire factory, used to allocate manufacturing overhead costs to products.
Direct Labor Hours
The hours worked by employees directly involved in the production of goods or services.
Allocation Base
A criterion or standard used to distribute costs among different cost objects, such as departments, products, or projects.
Overhead Costs
Expenses not directly attributed to the production of specific goods or services, such as rent, utilities, and office expenses.
Q3: An inferior good is:<br>A)any good of low
Q17: Suppose a monopolist must choose between two
Q22: The demand curve facing a perfectly competitive
Q33: When diminishing marginal returns set in, marginal
Q34: After an increase in demand in a
Q76: A shortage of textbooks is most likely
Q90: The supply of index cards is likely
Q95: Annie reallocates her budget until the ratios
Q125: The table below shows the price and
Q129: Producers supply larger quantities of any good