Figure 7.1 shows the U-shaped cost curves for a producer. In the table figure, A is the marginal cost curve, B is the average variable cost curve, and C is the average total cost curve. At an output of 10, the:
Figure 7.1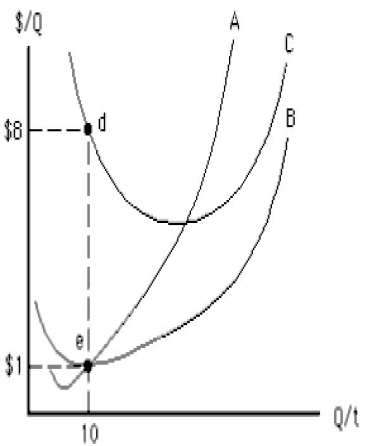
Definitions:
Average Total Cost Curve
A graphical representation showing how the average cost of production varies with the level of output.
Marginal Returns
The additional output that is produced by using one more unit of a given input, crucial in determining optimal production levels.
Total Fixed Costs
Expenses that do not change with the level of output or production in the short term, such as rent, salaries, and insurance.
Total Fixed Cost
The sum of all costs that remain constant regardless of the level of production or output within a given period.
Q14: A resource's earnings are all economic rent
Q21: Which of the following is not an
Q30: Assuming a constant cost industry, consumer surplus
Q44: Figure 5.9 shows three upward-sloping linear supply
Q58: For a monopolist that does not price
Q71: Opportunity cost is measurable only when prices
Q74: Suppose a single firm supplies all the
Q75: A firm enters into a consent decree
Q79: Anything that prevents new firms from competing
Q133: A firm facing a downward-sloping demand curve