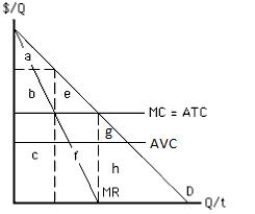
The figure below shows the cost and revenue curves faced by a monopolist. The area _____ represents monopoly profit with perfect price discrimination.
Figure 9.12
Definitions:
Downward-Sloping
Describes a line on a graph that decreases in height as it moves from left to right, indicating a negative relationship between two variables.
Inelastic Demand
A situation where the demand for a product does not significantly change with a change in the product's price, indicating that consumers are less sensitive to price changes.
Total Revenue
The total receipts from sales of a given quantity of goods or services. It is the total income of a business from its sales activity.
Price
The amount of money required to purchase something or the value that consumers are willing to exchange for a good or service.
Q17: The expected rate of return on capital
Q43: A relaxation of U.S. immigration laws and
Q61: The market labor supply curve is the:<br>A)vertical
Q65: Total deadweight loss in society is reduced
Q78: The marginal revenue product of labor equals:<br>A)marginal
Q107: Firms in a perfectly competitive market achieve
Q113: Which of the following is true of
Q114: Which of the following is likely to
Q145: A farmer in the Midwest who produces
Q150: The short-run industry supply curve in a