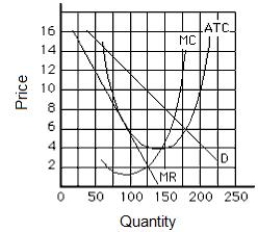
Figure 10.1 shows the demand, marginal revenue, and cost curves for a monopolistic competitor. The monopolistic competitor is in:
Figure 10.1.
Definitions:
Monopolistic Competition
A market structure in which many firms sell products that are similar but not identical, allowing for elements of competition and product differentiation.
Long-Run Equilibrium
A state where all firms in a market are making zero economic profit, with no incentive for entry or exit, reflecting a balance of supply and demand.
Average Total Cost
The total cost of production divided by the total quantity produced.
Monopolistically Competitive Firms
Companies in a market structure where many firms sell products that are similar but not identical, competing on factors besides price.
Q8: If total cost at Quantity = 0
Q10: For a firm operating in a perfectly
Q12: As the wage rate decreases, the amount
Q21: The following table shows data for a
Q26: The figure below shows the cost and
Q37: At a low wage rate, _.<br>A)usually there
Q45: When a price-discriminating monopolist divides its customers
Q83: If a firm hires a resource in
Q87: A monopolist's supply curve is the portion
Q111: Resource price differentials that trigger the reallocation