The following graph shows the labor market. The vertical axis measures wage in dollars, and the horizontal axis measures labor in hours. The opportunity cost in equilibrium is represented by the area _____.
Figure 11.1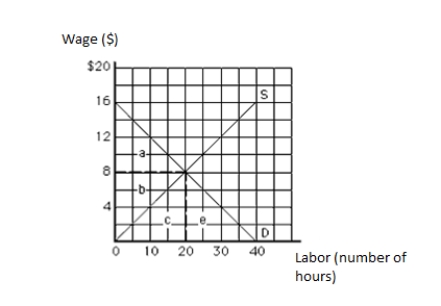
Definitions:
Consumption
The process by which goods and services are used up by individuals or groups, often analyzed within economic and sociological contexts.
Reduction
The process of simplifying a complex issue or substance into its component parts or a more basic form.
Production
The process of creating goods and services, often discussed in the context of economics, labor, and industry.
Machinic Assemblage
A concept in social theory describing a collection or arrangement of heterogeneous elements that work together as a functional whole.
Q6: The present value of an annuity that
Q19: The perfectly competitive firewood market is composed
Q52: When several resources are combined in the
Q58: During certain periods in the past few
Q83: An oligopoly is characterized by:<br>A)a few firms,
Q95: A horizontal long-run industry supply curve occurs
Q98: In a labor negotiation, a mediator:<br>A)represents the
Q117: A resource's marginal product is:<br>A)the revenue produced
Q145: A price-discriminating monopolist divides its customers into
Q148: Empirical estimates indicate that the annual deadweight