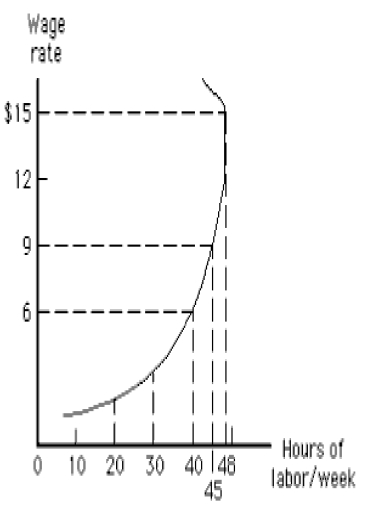
The figure given below shows a backward-bending labor supply curve for an individual. In the figure below, when the wage rate rises above $12, the substitution effect outweighs the income effect.
Figure 12.5

Definitions:
Conversion Costs
Expenses incurred in the process of converting raw materials into finished products, typically including labor and overhead costs.
Cost Of Production Report
A detailed report typically used in process costing that summarizes the material, labor, and overhead costs encountered during a period.
Allocation
Allocation refers to the process of assigning or distributing resources, costs, or expenses among different departments, processes, or projects within an organization, according to specific rules or criteria.
Equivalent Units
A concept used in cost accounting to convert partially completed goods into a number of complete units for inventory accounting purposes.
Q23: There is an inverse relationship between the
Q24: The Herfindahl index is the sum of
Q29: A labor union is a group of
Q47: When resource markets are free to adjust,
Q48: The marginal resource cost is the additional
Q57: Vertical integration has no effect on the
Q92: One reason investors may prefer bonds over
Q116: Product differentiation helps explain the slope of
Q125: Which of the following would lead a
Q146: Suppose an established manufacturer in an oligopoly