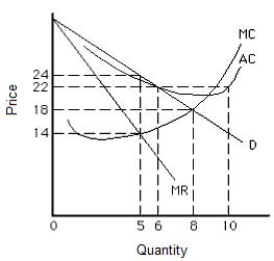
The figure below shows the cost and revenue curves for a natural monopolist. Suppose the monopolist was originally producing at a profit-maximizing output level. If regulators set price equal to marginal cost, the price will change from:
Figure 15.1
Definitions:
Marginal Cost
The increase in cost that comes from making one more unit of a product or service.
Equilibrium Price
The price at which the quantity of a good or service demanded by consumers equals the quantity supplied by producers, leading to a balance in the market.
Equilibrium Quantity
The quantity of goods or services supplied and demanded at the equilibrium price, where market supply equals demand.
Collusion
A secret or illegal cooperation or conspiracy, especially between parties to cheat or deceive others, commonly in the context of firms agreeing on prices or market shares.
Q4: The figure given below shows the marginal
Q8: By requiring that applicants for insurance policies
Q29: Which of the following problems is most
Q55: An ideal example of a vertically integrated
Q64: Eligibility for income assistance benefits requires a
Q70: Control of water pollution from pesticide runoff
Q70: According to Stigler's search model, the marginal
Q75: An externality is:<br>A)a cost of a transaction
Q99: The winner's curse is more likely to
Q114: Intellectual property:<br>A)requires copyright protection that is expensive