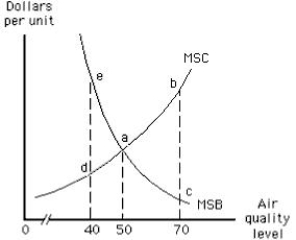
The following graph shows market equilibrium in the presence of an externality. The optimal air quality level is 50.
Figure 17.3
Definitions:
Few Substitutes
A market condition where there are limited alternatives for a product, giving the product a higher degree of market power and potentially leading to higher prices.
Long Run Equilibrium
A state where all inputs can be adjusted by firms and all prices can fully adapt, leading to resource allocation where supply equals demand.
Industry
Refers to a specific sector of the economy that produces and distributes goods or services, such as the technology or pharmaceutical industry.
Short Run
A period in economic analysis during which some factors of production are fixed, allowing only some inputs or operations to be adjusted.
Q2: According to Shepherd, trucking, _, securities trading,
Q4: Children of female headed-households are five times
Q49: A metal-stamping factory moves next to a
Q62: Which of the following statements is true?<br>A)Increased
Q74: Which of the following provides a positive
Q77: Which of the following is not correct
Q79: The marginal social benefit curve is downward
Q86: Anticompetitive business practices are illegal per se:<br>A)only
Q106: "Mere size is no offense" is an
Q110: Governments often subsidize activities that generate positive