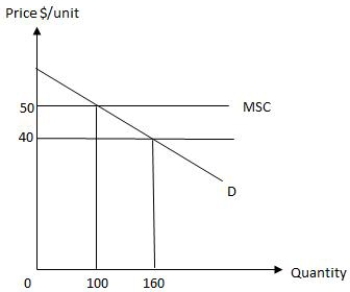
The following graph shows equilibrium in a market in the presence of an externality. The amount by which the total social cost of producing the private equilibrium level of output exceeds the total social benefit is _____.
Figure 17.1
Definitions:
Riegle-Neal Interstate Banking
Legislation passed in the United States in 1994 that allowed bank holding companies to acquire banks in other states, effectively removing barriers to interstate banking.
FDIC
Stands for the Federal Deposit Insurance Corporation, a U.S. government agency that provides deposit insurance to depositors in American commercial banks and savings institutions, protecting them against bank failure.
Federal Reserve
The central banking system of the United States, responsible for setting monetary policy, regulating banks, and ensuring financial stability.
Savings And Loan Crisis
A financial crisis in the 1980s and 1990s involving the insolvency of numerous savings and loan associations in the United States.
Q4: In the late nineteenth century, technological improvements
Q15: When income is distributed perfectly equally in
Q16: In a two-country, two-commodity framework, when one
Q19: The following graph shows U.S. demand for
Q27: Data on the U.S. income distribution suggests
Q49: If the minimum efficient scale in woodstove
Q61: If firms accused of antitrust violations sign
Q81: The following graph shows U.S. demand for
Q125: Which of the following is an example
Q146: The purpose of social insurance is to:<br>A)encourage