Multiple Choice
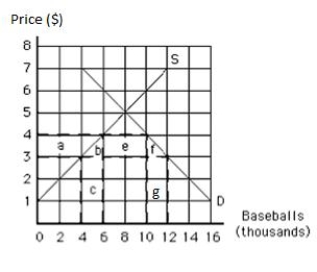
The following graph shows the supply of and demand for baseballs in the United States. If the world price of a baseball is $3, then the quantity of baseballs demanded is _____.
Figure 19.3
Definitions:
Related Questions
Q51: It is in the long-run economic interest
Q58: The following table shows per-day production data
Q83: During a year, the government of a
Q92: In _,fixed manufacturing costs are included as
Q113: In order to dispose of the nuclear
Q128: Quotas are favoured over free international trade
Q133: People on welfare programs who are going
Q137: Which of the following is a difference
Q169: Variable costing is also called direct costing
Q183: Which of the following would be subtracted