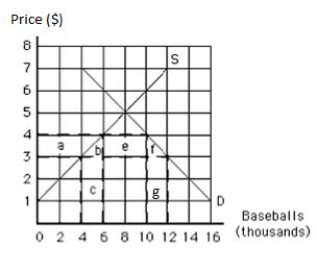
The following graph shows the supply of and demand for baseballs in the United States. If the world price is $3 per baseball and a tariff of $1 per baseball is imposed, the net welfare loss of the tariff is shown by the area _____.
Figure 19.3
Definitions:
Residual Income
The amount of income that an individual or company retains after accounting for all costs and expenses.
Producer Price Index
An economic indicator that measures the average changes in prices received by domestic producers for their output.
Q2: Bureaus are:<br>A)special-interest groups that try to influence
Q13: Throughput contribution equals _.<br>A)variable costs minus fixed
Q17: Developing countries have higher birth rates because:<br>A)families
Q46: Identify the correct statement about the distribution
Q47: An unintended consequence of an expanded safety
Q47: If production is subject to economies of
Q50: Unpriced byproducts of production or consumption that
Q77: On average, about half the labor force
Q144: The cost of the resources used by
Q182: AAA Manufacturing Inc,makes a product with the