Multiple Choice
The following graph shows the demand for and domestic supply of a good in a country. If the country decides to trade, then at a world price of $1.00 _____.
Figure 19.2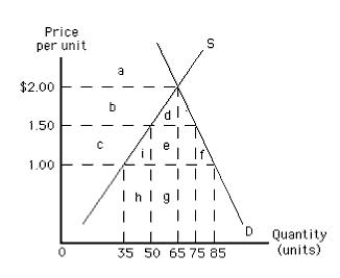
Definitions:
Related Questions
Q2: Dumping refers to selling a commodity abroad
Q6: Which of the following was a motive
Q8: An aging population poses fiscal problems for
Q12: In the United States, _.<br>A)insurance premiums are
Q16: Which of the following is true of
Q36: The federal government's earned-income tax credit:<br>A)provides support
Q41: In general, it can be asserted that
Q74: If the U.S. dollar depreciates, it becomes
Q83: A problem for developing countries is that
Q110: Which of the following statements is true