Infographic 30.7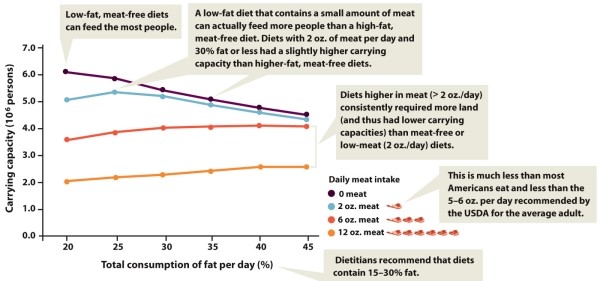
-Refer to Infographic 30.7, explain how the number of people an area of land can support varies with the meat content of their diet. What happens to that relationship when the total consumption of fat per day increases to 35% or more?
Definitions:
Q2: _ affects diet by increasing the demand
Q22: "Grassland systems are a rich source of
Q26: Compared with coal-fired plants, nuclear power plants
Q29: A temperate forest _.<br>A) is characterized by
Q30: The disadvantages of urbanization for a society
Q56: The type of forest is determined by
Q58: Which of the following is NOT a
Q64: The coxal joint is most likely found
Q123: Represented by the flow of charged particles
Q128: Anything that occupies space and has mass.<br>A)Weight<br>B)Mass<br>C)Matter<br>D)Energy