Figure 8-16 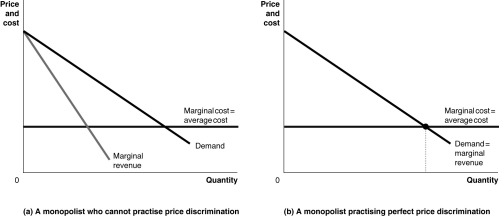
-Refer to Figure 8-16.Graph (a)represents a monopolist who cannot price discriminate and graph (b)represents a monopolist practising perfect price discrimination.On each graph,identify the monopoly price,the monopoly output,the efficient output,and the areas representing profit,consumer surplus,and deadweight loss.
Definitions:
Reconstruction Finance Corporation
Federal program established in 1932 under President Herbert Hoover to loan money to banks and other institutions to help them avert bankruptcy.
Herbert Hoover
The 31st President of the United States, serving from 1929 to 1933, best known for his leadership during the early years of the Great Depression.
Smoot-Hawley Tariff
1930 act that raised tariffs to an unprecedented level and worsened the Great Depression by raising prices and discouraging foreign trade.
Economic Crisis
A period characterized by widespread financial instability, which may lead to a recession and significantly impact employment and wealth.
Q19: Refer to Figure 8-12.ETSA Power is a
Q22: Research has shown that most economic profits
Q50: The term 'early adopters' refers to<br>A) firms
Q103: The process a firm uses to turn
Q125: Refer to Figure 7-6.Suppose the firm produces
Q157: Refer to Figure 8-10.The deadweight loss due
Q174: Maria's Yiros House sells yiros.The cost of
Q196: Refer to Figure 8-2.If the firm's average
Q204: Average variable cost can be calculated using
Q205: Explain whether a monopoly that maximises profit