Table 6-4
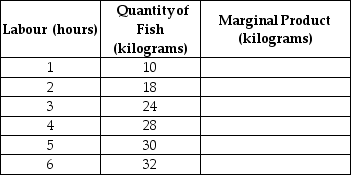
-Refer to Table 6-4.The table above shows the relationship between hours spent fishing and the quantity of fish caught for Juan,a commercial fisherman.
a.Complete the Marginal Product column in Table 6-4.
b.Characterise the production function,i.e.does the production function display increasing marginal returns,diminishing marginal returns,etc.
c.Using the data above,graph Juan's marginal product curve.Be sure to label the horizontal and vertical axes.Is your graph consistent with your answer to part (b)? Explain.
d.Juan uses the following inputs for fishing - a small wooden boat (B),a fishing pole (P)and of course,his labour (L).Treating the boat and the fishing pole as fixed inputs and using the data above,graph Juan's Total Product of Labour curve.Be sure to label the horizontal and vertical axes.
e.(Extra Credit)The opportunity cost of Juan's time is $8 per hour.If Juan receives $2 per kilogram for his fish,what is the optimal number of hours he should spend fishing? Explain how you arrived at your answer.Hint: Recall marginal benefit and marginal cost analysis.
Definitions:
Data Processing
The collection, manipulation, and analysis of data to extract useful information, support decision-making, or fulfill specific purposes.
Dashboard Functionality
Definition: The features offered by a digital dashboard, which displays key data points and metrics in a simplified and understandable format, often for the purpose of tracking performance.
Distribution
Definition: The process of making a product or service available for the consumers or business users who need it, through various channels.
Data Analytics
The process of examining datasets to draw conclusions and identify patterns, trends, and insights using specialized systems and software.
Q3: Which of the following are implicit costs
Q4: In which market structure is it not
Q7: With perfect price discrimination there is<br>A) no
Q39: The change in a firm's total cost
Q66: Which of the following is a factor
Q152: If,at a price of $24,Octavia sells 36
Q154: Refer to Figure 6-1.The marginal product of
Q178: Publishers practice price discrimination when they sell
Q186: When the marginal product of labour rises<br>A)
Q200: Joss is a marketing consultant.Iris and Daphne